Current methods of vision testing provide a limited view on visual health.
Two independent metrics of visual performance are acuity and peak contrast sensitivity.
Acuity testing measures fine visual resolution with visual targets of high contrast, presented at smaller and smaller sizes. The Snellen chart remains dominant at the point of care, but it is no longer used in clinical trials. The charts used in clinical trials—the ETDRS and Bailey-Lovie charts—represent the first substantial update to Snellen acuity testing in more than 100 years, but are not used in clinical practice.
-
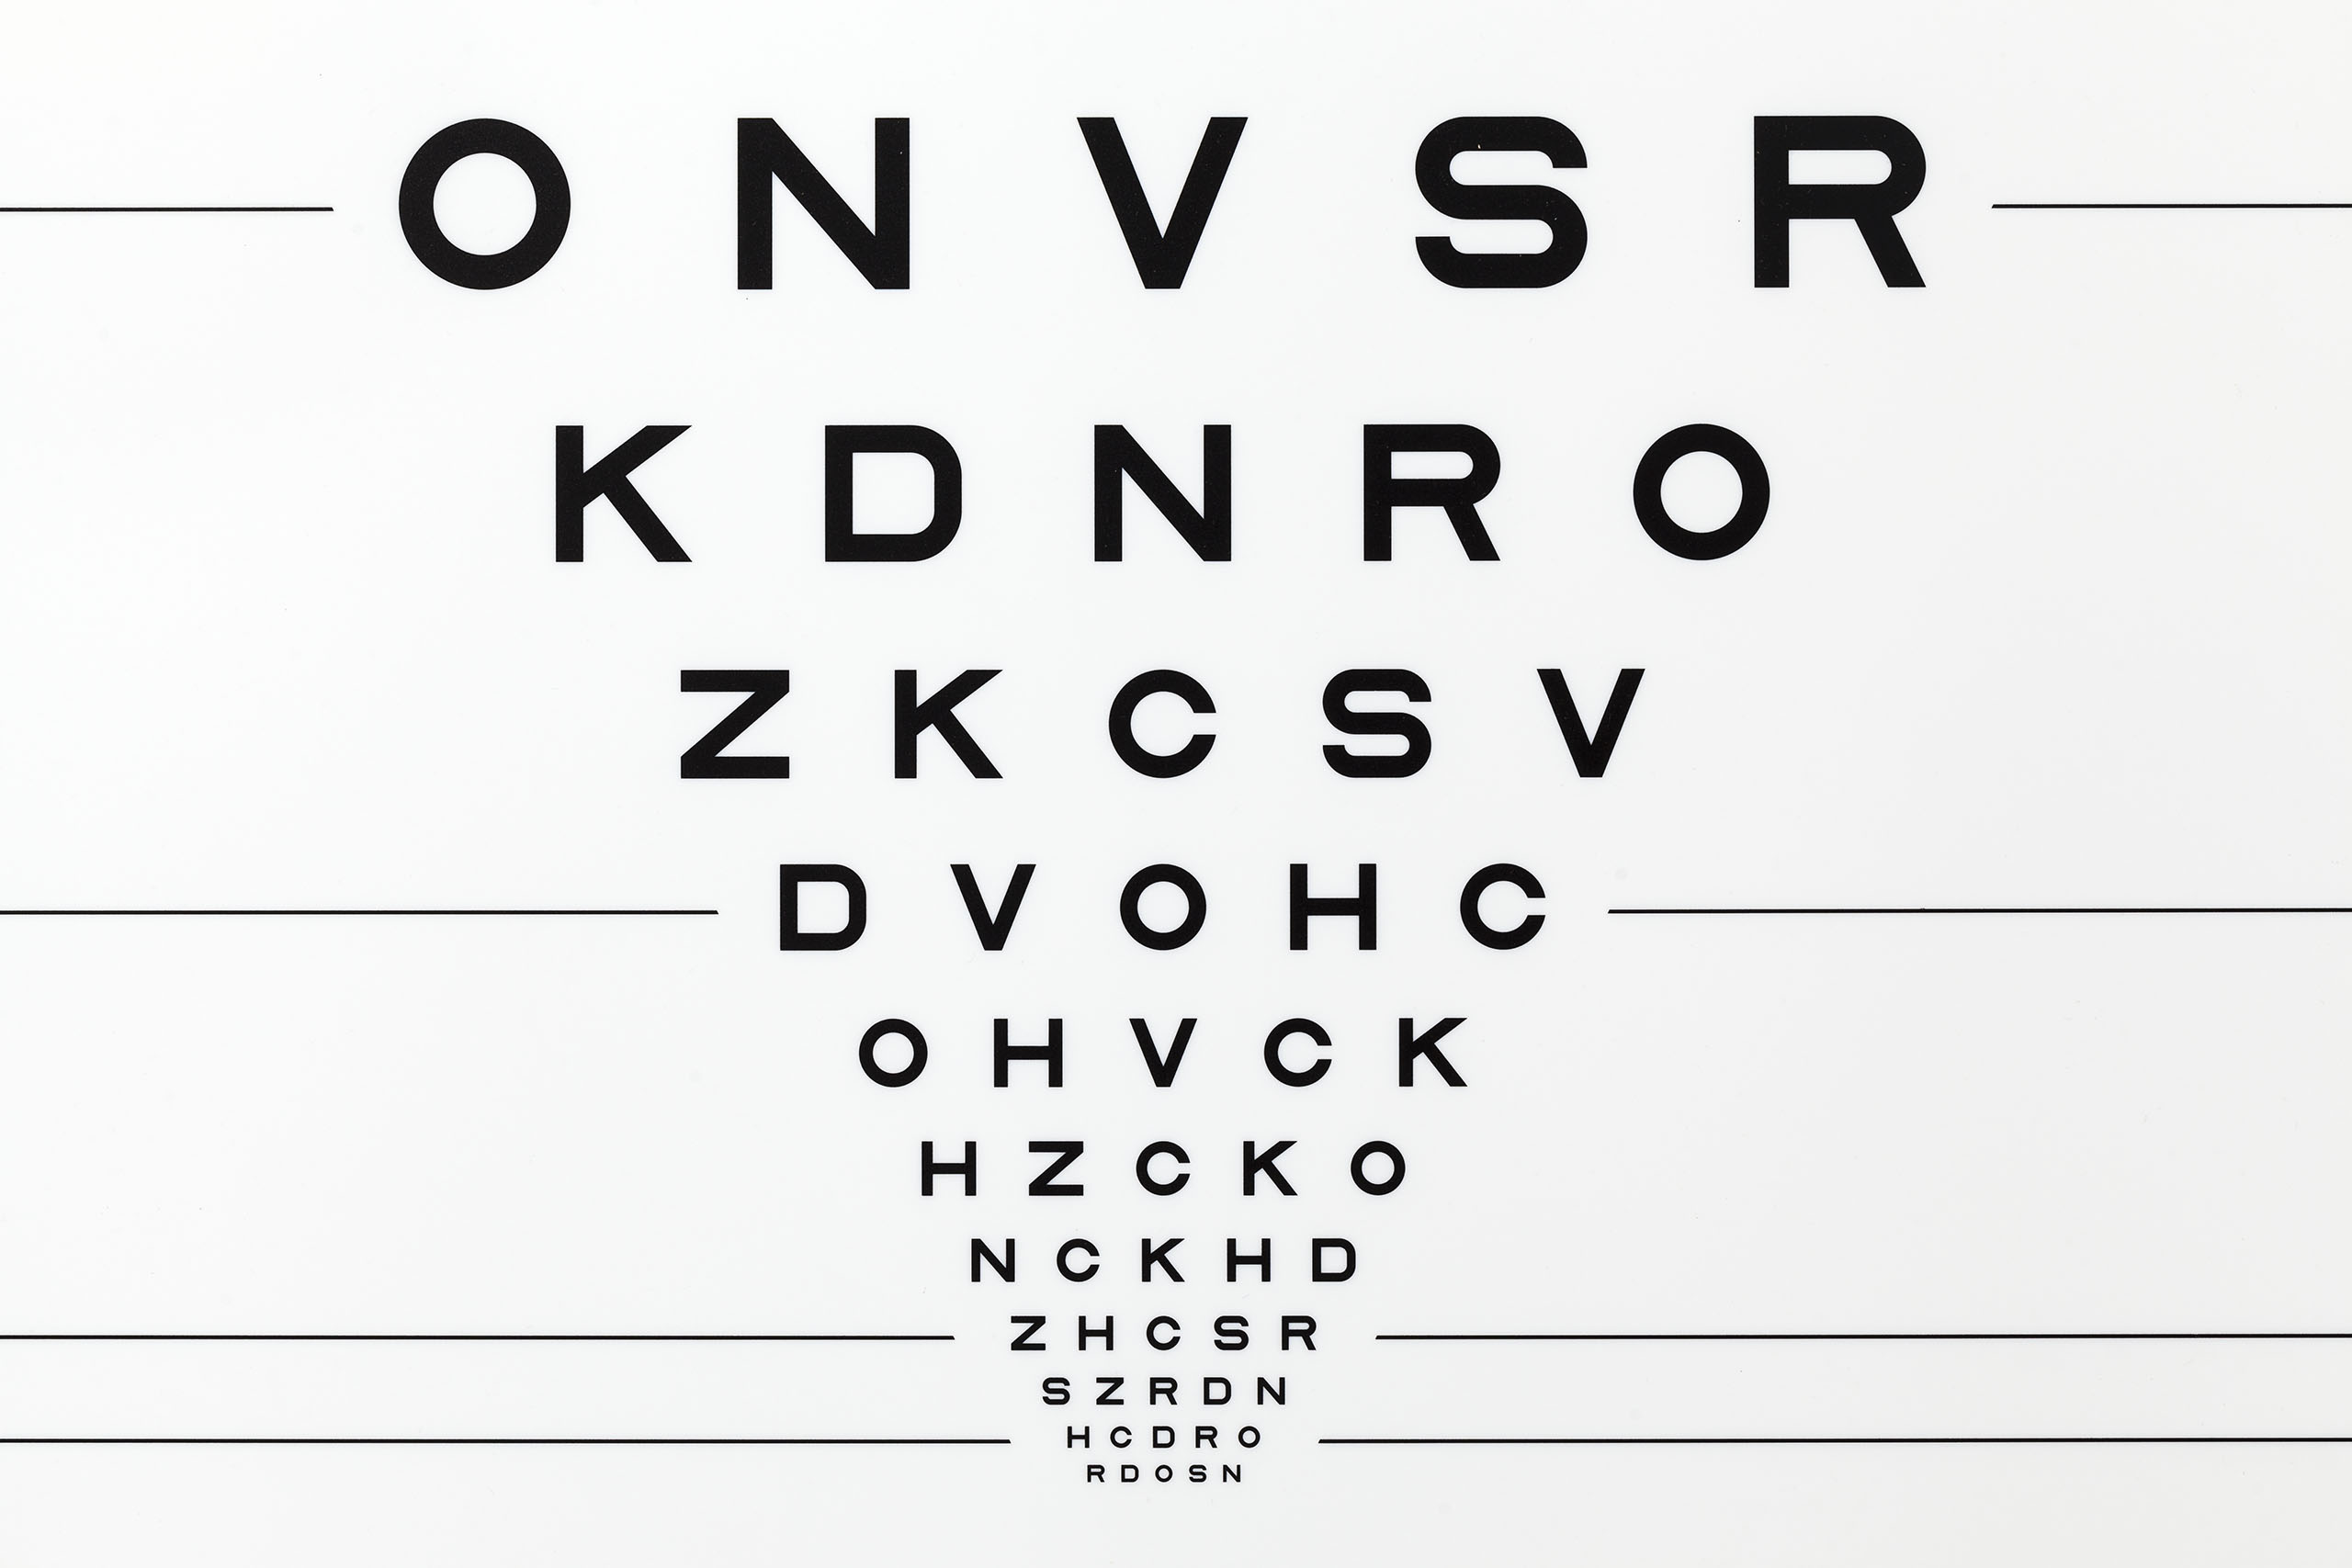
Clinicians measure visual acuity by testing a person’s ability to discern standard patterns (usually letters or numbers) at a given distance according to a fixed standard.
-
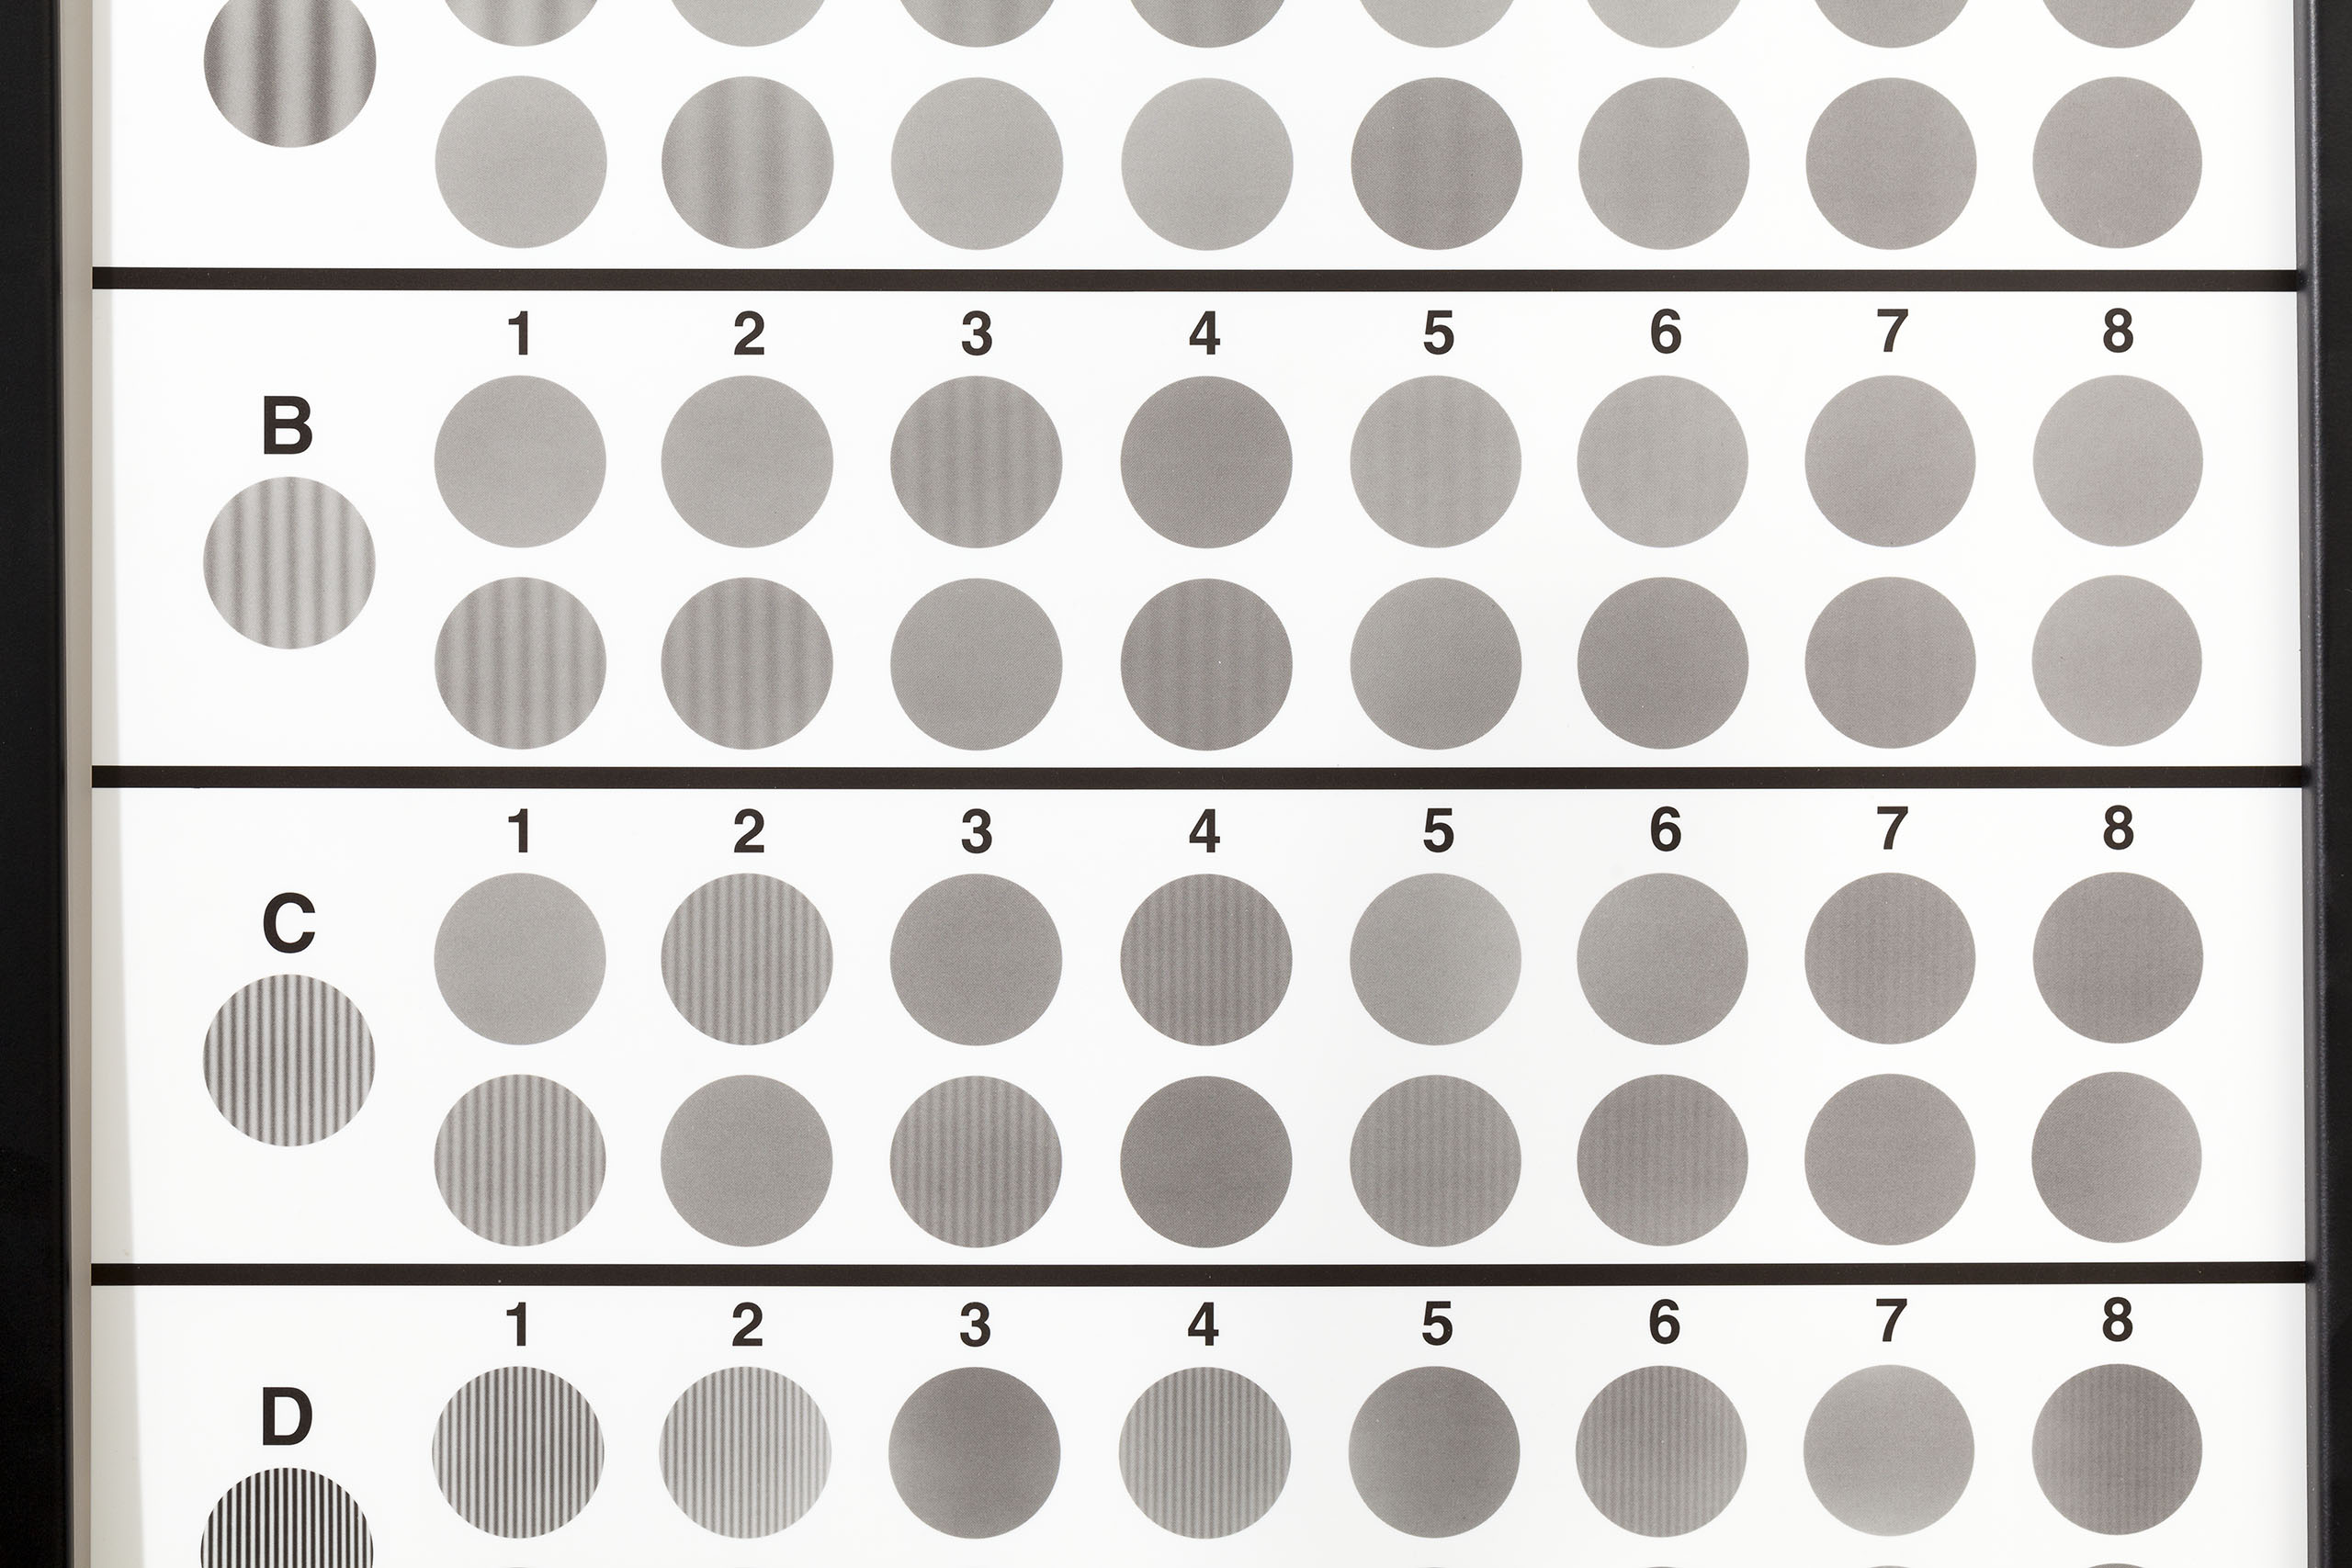
Clinical researchers measure contrast sensitivity by showing patients optotypes (standardized symbols for testing vision) that represent many combinations of threshold contrast and spatial frequency.
Contrast sensitivity testing measures the ability to distinguish subtle light-dark differences, by presenting fainter and fainter visual targets. The world we see is not high-contrast (black-on-white or white-on-black). Therefore contrast sensitivity provides a better assessment of everyday, functional vision: how a person uses vision to carry out visual tasks in the real world.
The Pelli-Robson chart, the current research standard for examining contrast sensitivity, measures the limits of seeing low contrast targets, using letters at a constant, intermediate size. MARS charts use a similar principle to measure contrast sensitivity at near distances.
A more complete visual assessment is provided by the contrast sensitivity function, which describes contrast sensitivity at multiple target sizes, beyond the single scale measured by the Pelli-Robson and MARS charts. Several clinical tests of the contrast sensitivity function have assessed vision across multiple scales using sine-wave gratings of different widths and contrast. In principle, this approach presents an advantage to previous tests of acuity and peak contrast sensitivity, which focus on changing only the size or contrast of visual targets. In practice, these tests have not delivered on the clinical promise of the contrast sensitivity function, due to their imprecision.
-
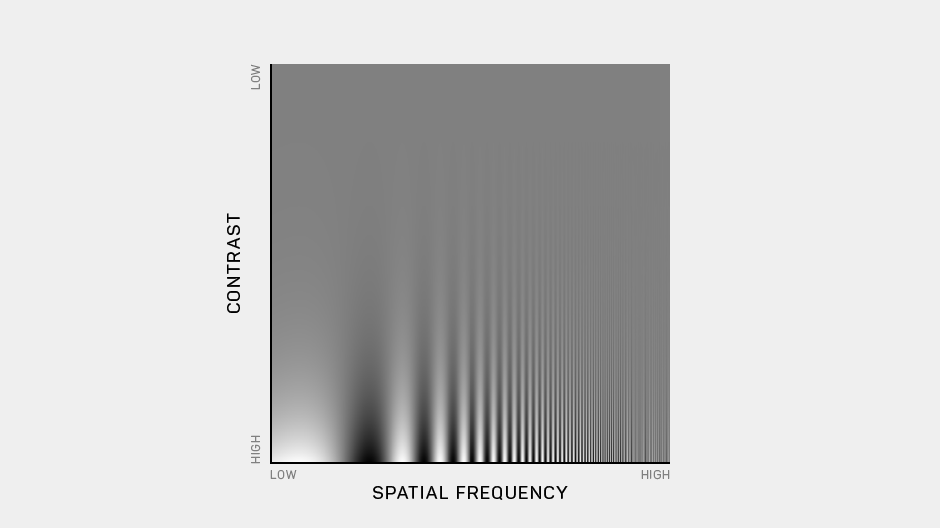
This is a canonical image of the contrast sensitivity function, developed by John Robson and colleagues at the University of Cambridge. Contrast (gray-level modulation) changes along the vertical axis of this image; spatial frequency (or size) changes along the horizontal axis. The contrast sensitivity function marks the boundary between the visible and invisible.
-
In current practice, visual acuity is tested by changing the size of high-contrast targets.
-

Peak contrast sensitivity is tested by changing the contrast of large visual targets.
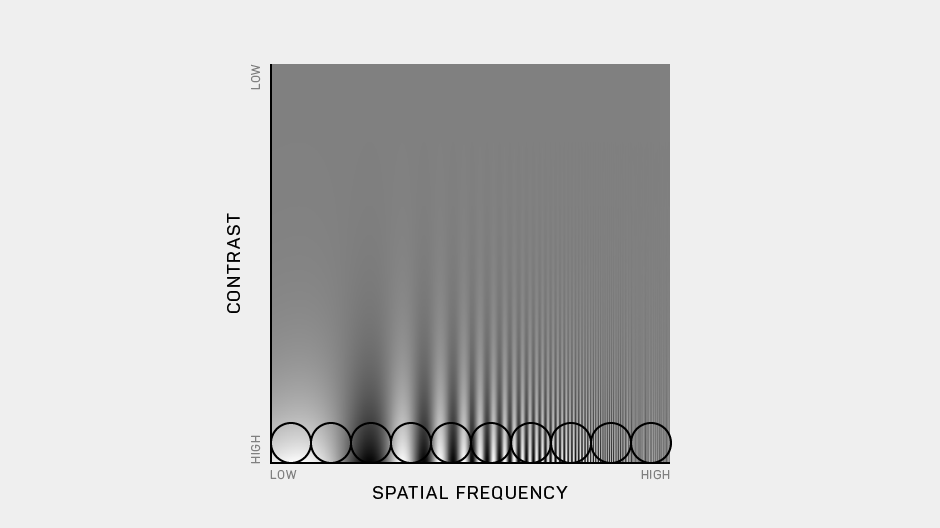
The Manifold® Platform, which jointly tests vision in the two critical dimensions of target contrast and target size (spatial frequency), provides a precision assessment of vision via the full contrast sensitivity function. Threshold contrast represents the contrast level that defines the boundary between targets that are visible and targets that are invisible. Spatial frequency represents the level of details in a stimulus, given its size at a particularly viewing distance. For example, a high-frequency pattern has more details than a low-frequency pattern.
The challenge of measuring the contrast sensitivity function is that it is not a single value, but a contour. Therefore, it cannot be measured on a one-dimensional scale, like acuity. Rather, it is a two-dimensional contour that defines the lowest contrast level a person can detect for each spatial frequency tested. The contour marks a boundary between the visible and invisible, and the area under the contour has been referred to as “the world we can see.”
Scientists have been measuring the contrast sensitivity function for many years. The trouble is: the laboratory tests of contrast sensitivity function have been cumbersome and too time-consuming—45 to 60 minutes or more—to administer to patients. Tests of the contrast sensitivity function conducted with paper charts are shorter, but lack both fine resolution and broad flexibility, and the results need manual scoring. Some computerized tests of contrast sensitivity allow the randomization of visual targets, but simply translate the strategies of chart testing to digital displays. As a result, precision assessment of contrast sensitivity function remains impractical today in the lab and clinical settings.
We’re trying to change that.